What This Is About
SB 6346 would create Washington’s first personal income tax in nearly a century. A 9.9% rate on income above $1 million, projected at $3.4 billion annually, it passed the Senate 27-22 on party lines and is now in the House. Washington voters have rejected income taxation ten times at the ballot over the last hundred years. This is the most contested piece of legislation the state has seen in a generation.
Washington’s legislature runs an online sign-in system for committee hearings. Anyone can go to the legislative website and register their position on a bill, pro or con, without testifying. Legislators see the totals. The system is designed to give ordinary people a voice even if they can’t show up in Olympia. On SB 6346, it may be the only meaningful voice many residents have: the legislature designated the bill an emergency measure, which prevents a voter referendum. There is no ballot option. For most Washington residents opposed to this bill, signing in here, or calling their representative directly, is the entire menu.
When those numbers get manipulated, the perception gets manipulated. On a bill this significant, in a state with a century of voter resistance to income taxes, that is not a minor data quality problem. It is a distortion of the democratic signal legislators and journalists are using to understand where the public actually stands.
Which is why getting the analysis right matters. And why it matters that GeekWire got it wrong.
GeekWire reported Monday (Added 2/24/26: and apparently the Seattle Times too) that fraudulent sign-ins were used to inflate CON opposition to SB 6346. Named public officials confirmed their identities appeared without their consent. The framing was clear: the anti-tax side cheated.
The data tells a different story.
The story was built on analysis provided by Invest in Washington Now, a PRO-tax advocacy group that examined CON submissions and held a press conference. They reported a true incident, but failed to do the basic symmetric analysis needed to justify the narrative they attached to it.
I downloaded the full legislative sign-in export at 5:51 PM Pacific on February 23rd, 123,289 records, and ran the same tests on both positions. Here is what it shows.
The data confirms fraud. It does not confirm that fraud explains the opposition. Those are different claims, and the difference matters enormously on a bill this significant.
Who Actually Showed Up
“Legitimate” here means a unique name that appears at least once during daytime hours (7 AM to 11 PM PT). The export does not verify identity.
CON: roughly 90,000 legitimate unique participants.
CON was underrepresented during overnight Pacific hours, which is exactly what you would expect from Washington residents who are asleep at 2 AM. By every geographic measure in the data, CON’s daytime participation pattern is consistent with Washington residents showing up. CON does have an overnight anomaly, roughly 2,800 names that appear only in overnight windows and never in five days of daytime sign-ins, which reduces the legitimate unique count to roughly 90,000. More on this below.
PRO: roughly 9,100 apparent legitimate unique participants.
The PRO side has 9,919 unique names across the full hearing. But between 1 and 5 AM Pacific on February 20th, 934 submissions arrived in a single five-hour overnight window (1:00–5:59 AM). That window accounts for about 8.4% of all PRO submissions across the entire hearing period. Of those 934 submissions, 807 were unique names. Set those aside, and you have roughly 9,100 apparent legitimate PRO participants.
That is a roughly 10-to-1 ratio (90,408 CON vs 9,112 PRO in the export, after removing overnight-only names as defined here). A margin like that on a contested tax bill during a legislature that removed opportunity for feedback other than this survey is not, on its own, statistically implausible.
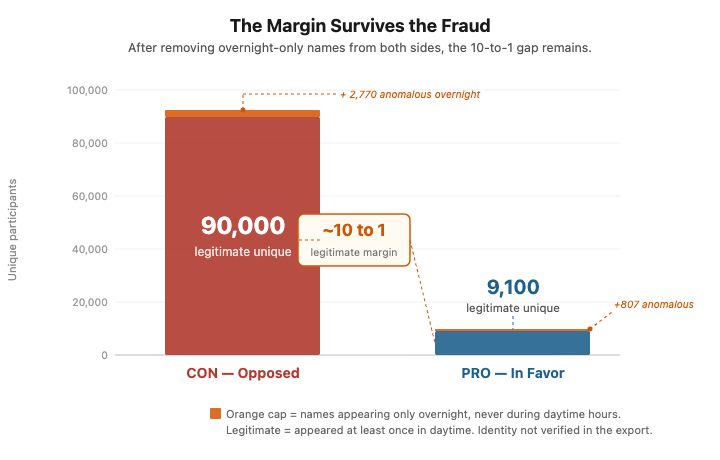
Here is what the data actually shows. Both sides have anomalous overnight submissions that do not match the daytime participation signature. On the CON side, roughly 2,800 names, about 3% of their total, appear only overnight and never during five days of daytime sign-ins. On the PRO side, 807 names, about 8% of their total, appeared in a single five-hour overnight window. Both anomalies are real. But after removing them, roughly 90,000 legitimate CON participants remain against roughly 9,100 legitimate PRO participants. The fraud did not manufacture the opposition. The fraud, such as it is, was larger in proportional terms on the side that was already losing 10 to 1.
The story treated fraud as the explanation for the margin. The data shows the margin survived the fraud. On every test, the more anomalous signal sits on the PRO side, not the CON side.
The Geography Test
The most straightforward test requires no statistics at all. Washington residents sleep on Pacific time. If you plot submissions by hour of day, genuine local participation should cluster during waking hours and drop off after midnight.

CON activity drops overnight, consistent with local participants sleeping on Pacific time.
PRO shows a pronounced spike on February 20th between 1 and 5 AM, running at close to 190 submissions per hour for five straight hours, while Washington residents were asleep and the CON side was quieter than usual. The spike is not a few night owls.
The Community Test
Here is where it gets harder to explain away.
Across five full days of daytime sign-ins, we have an observable picture of who the PRO community actually is. Roughly 9,100 people engaged during normal waking hours. Five days is a long window. If you are a genuine PRO supporter, the probability that you appeared in that record at least once is high.
Name communities have statistical fingerprints. Any two groups drawn from the same population will share common names at a predictable rate, the same demographic mix, the same frequency of “James Kim” or “Sarah Johnson.” So even if the overnight submitters were entirely different individuals from the daytime crowd, you would still expect their names to collide with the daytime pool at a rate consistent with drawing from the same community. The longer the daytime window, the higher that rate gets.
You can test this directly. Draw 934 random names from the known PRO pool and ask how many appear somewhere in five days of daytime submissions. Across 10,000 simulations, the answer is about 86%.
The observed overnight overlap was 13.6%. Nearly nine out of ten overnight names had never appeared in five days of daytime PRO submissions.

Every one of the 10,000 simulations produced more overlap than the overnight batch did. The minimum was 82%.
The same test applied to CON tells a similar structural story. CON’s overnight names also show only 21–25% overlap with the daytime pool across five nights, against an expected 90–94%. Both positions have overnight participants who are largely absent from the five-day daytime record. The difference is in magnitude and concentration. CON’s anomaly spreads 2,800 names across five nights. PRO’s concentrates 807 names into a single five-hour overnight window. The PRO signal is sharper, but the underlying pattern of overnight names that don’t match the daytime community appears on both sides.
The Name Collision Test
In any large population, names repeat. If you pull 934 people at random from Washington state, some of them will be named James Kim. Some will be named Sarah Johnson. That is not fraud, that is just how names work. The question is whether the names repeat at the rate you would expect given the size and demographic makeup of the community you are drawing from.
934 overnight PRO submissions produced zero repeated names. Not fewer than expected. Zero.

From a genuine community of roughly 9,100 PRO supporters, you would expect around 60 name collisions in a sample that size, just by chance. We ran 10,000 simulations drawing from the actual PRO participant pool. Every single one produced collisions. The lowest was around 30. The observed overnight batch produced none.
The most consistent explanation is that someone built a list and specifically made sure no name appeared twice. That is not what organic participation looks like. That is what a curated submission operation looks like.
The CON side shows the opposite pattern. Several overnight windows had more name repeats than expected, consistent with people resubmitting or households submitting together. Messy, in other words. The kind of messy that real participation produces.
934 submissions. 934 unique names. Zero repeats. That is the number that should be in the headline.
On CAPTCHA
The form uses CAPTCHA verification. This comes up because some coverage implies it as a meaningful protection.
It is not, against this class of problem. CAPTCHA distinguishes automated bots from humans. It provides no protection against human click farms, which are operations that pay workers in other countries to solve CAPTCHAs manually and complete form submissions by hand. This is a commercial industry. Services are publicly listed, priced at $1 to $3 per 1,000 submissions.
The pattern observed on February 20th is most consistent with coordinated human submissions using a curated name list: overnight timing, near-zero overlap with the daytime community, and zero name collisions across 934 submissions. A click-farm-style mechanism is one plausible explanation. The public export cannot prove attribution without server-side logs.
At those rates, the 934 anomalous overnight PRO submissions represent a trivial cost against a bill projecting $3.4 billion in annual revenue.

On the Audit Trail
The public data export does not include IP addresses. Whether internal server logs exist and whether they have been preserved is unknown. That is a question the AG’s investigation should answer before those logs age out.
Even with full IP logs, naive geolocation proves little. Click farm operations commonly route through VPNs, and an IP address alone does not establish geographic origin without infrastructure-level analysis of the autonomous system it belongs to. What you want to know is not which city the IP is registered to. You want to know whether it belongs to a residential ISP, a datacenter, or a known VPN provider range. Those are different findings with different implications.
What This Means
Neither finding resolves cleanly without a real investigation. The named official impersonations on the CON side are real and the AG should pursue them. But confirming specific named victims is the easiest fraud to find because the victims can self-report. That is not a statistical audit, and it does not address what the data shows on the other side.
Both findings warrant investigation. The system made both possible.
There is a useful analogy here. Risk-Limiting Audits are the gold standard for post-election verification. The premise is that you do not need to check every ballot to establish confidence in the outcome. You need to bound the probability that the anomalies are large enough to change the result. Advocates of RLAs often argue, correctly, that statistical evidence is sufficient to certify an election without requiring individual identity verification for every voter.
That is precisely what this analysis does. It does not identify every fraudulent submission. It asks whether the fraud on either side was large enough to manufacture the margin. The answer is no. After removing every overnight anomaly on both sides, roughly 90,000 legitimate CON participants remain against roughly 9,100 legitimate PRO participants. If statistical sampling is rigorous enough to certify an election, it is rigorous enough to evaluate a legislative sign-in system.
The sign-in infrastructure was built for access. Low friction, no identity binding, no rate limiting that held against coordinated submission. I have written before about how Washington has accumulated individually defensible choices that collectively produce systems incapable of defending their own integrity. The legislature is now trying to adjudicate participation fraud on infrastructure that was never designed to be auditable.
The question that does not get asked in any of the coverage: why did Washington build a public participation system with no ability to verify, audit, or forensically reconstruct what happened, and what would it take to build one that can?
Methodology
All analysis was run on the public CSV export of sign-in records for SB 6346, downloaded at 5:51 PM Pacific on February 23rd, 123,289 records total. Every test was applied symmetrically to both positions using the same parameters. The analysis does not attempt attribution. It bounds the probability of innocent explanation under stated assumptions.
Geographic analysis. Submissions were binned by Pacific hour. Each position’s hourly share was compared to that position’s overall base rate across the full hearing. CON activity drops overnight relative to daytime hours, consistent with participants sleeping on Pacific time. PRO showed a concentrated spike on February 20th between 1 and 5 AM, sustaining close to 190 submissions per hour across five consecutive hours. The 1 to 5 AM PT window corresponds to mid-day hours in parts of Asia and the Middle East.
Name overlap test. This test requires no statistical model and is not sensitive to assumptions about name distributions. For each overnight window with at least 20 submissions, the unique names were compared against that position’s daytime submissions (7 AM to 11 PM) across the full hearing. Overlap fraction equals names appearing in both sets divided by total overnight unique names.
To establish expected overlap, 10,000 random samples of size n were drawn without replacement from that position’s full-hearing participant pool, and the overlap fraction with the daytime set was computed for each draw. On February 20th, the PRO observed overlap of 13.6% fell below the minimum of all 10,000 simulations. The lowest simulated value was about 82%. CON overnight overlap ranged from 21–25% across five nights, against a bootstrap expectation of 90–94%, also below every simulation on every night. Both positions show overnight communities that are largely disconnected from their daytime pools.
Birthday-corrected collision analysis. Raw name duplication rates are not meaningful without correcting for sample size. In any large sample, some names will repeat by chance regardless of how the data was generated. The expected number of name collisions for a sample of size n drawn from a pool of N_effective distinct names follows the occupancy problem:
expected unique names = N_effective × (1 − e^(−n/N_effective)) expected collisions = n − expected unique
N_effective was estimated separately for each position from that position’s own daytime submissions using the method-of-moments estimator: N_effective = u² / (2s − u), where u is the number of unique names and s is total daytime submissions. This assumes the overnight community draws from the same underlying name distribution as the daytime community. That assumption is explicit and falsifiable. CON showed collision excesses across multiple nights, with effect sizes of 1.8%, 2.3%, and 4.1% on the three most anomalous nights. PRO worst night (February 20th): 0 observed collisions, approximately 60 expected, deficit of ~60. Statistical significance was assessed using the Poisson distribution, upper-tail for excess and lower-tail for deficit.
Sensitivity. The collision deficit finding holds unless the PRO overnight community drew from a pool of at least approximately 200,000–300,000 distinct name combinations, roughly 20–30 times the total observed PRO participant base across the full hearing. The entire PRO participant pool across five days is 9,919 unique names. A reader who disputes this should specify what pool size they would defend, and explain why that entire community was absent from every daytime window across the hearing period.
Duplicate submissions. The same name appearing multiple times are a separate question and not the subject of this analysis. Some duplication is expected in any real participation dataset; people resubmit, households share names, and common names genuinely recur. The relevant question is whether duplication rates deviate from what the population would predict. The overnight CON windows showed collision excesses consistent with resubmission or household participation. That is a different signal from the overnight PRO deficit, and it points in a different direction
What this analysis cannot determine. The geographic origin of submissions, the identity of any operator or coordinator, whether the system maintains server-side logs, and the mechanism behind any anomalous pattern. Attribution of intent from behavioral data alone is not supportable. These findings bound the probability of innocent explanation. They do not establish what the non-innocent explanation is.
I ran this analysis quickly after the GeekWire story published. There may be subtle issues in the methodology I have not caught. I am confident it is directionally correct. If you find an error, I will correct it.
Pingback: Duplicates Are Not the Problem | UNMITIGATED RISK
Pingback: The Signal They Chose to Ignore | UNMITIGATED RISK