Tag Archives: Performance

How Facebook can avoid losing $100M in revenue when they switch to always-on SSL

Recently Facebook announced that they will be moving to Always-On-SSL, I for one am thrilled to see this happen – especially given how much personal data can be gleamed from observing a Facebook session.

When they announced this change they mentioned that users may experience a small performance tax due to the addition of SSL. This is unfortunately true, but when a server is well configured that tax should be minimal.

This performance tax is particularly interesting when you put it in the context of revenue, especially when you consider that Amazon found that every 100ms of latency cost them 1% of sales. What if the same holds true for Facebook? Their last quarter revenue was 1.23 billion, I wanted to take a few minutes and look at their SSL configuration to see what this tax might cost them.

First I started with WebPageTest; this is a great resource for the server administrator to see where time is spent when viewing a web page.

The way this site works is it downloads the content twice, using real instances of browsers, the first time should always be slower than the second since you get to take advantage of caching and session re-use.

The Details tab on this site gives us a break down of where the time is spent (for the first use experience), there’s lots of good information here but for this exercise we are interested in only the “SSL Negotiation” time.

Since Facebook requires authentication to see the “full experience” I just tested the log-on page, it should accurately reflect the SSL performance “tax” for the whole site.

I ran the test four times, each time summing the total number of milliseconds spent in “SSL Negotiation”, the average of these three runs was 4.111 seconds (4111 milliseconds).

That’s quite a bit but can we reduce it? To find out we need to look at their SSL configuration; when we do we see a few things they could do to improve things, these include:

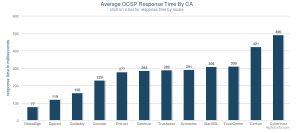
Let’s explore this last point more, the status check the browser does is called an OCSP request. For the last 24 hours their current CA had an average world-wide OCSP response time of 287 ms, if they used OCSP Stapling the browser would need to do only one OCSP request, even with that optimization that request could be up to 7% of the SSL performance tax.

Globalsign’s average world-wide OCSP response time for the same period was 68 milliseconds, which in this case could have saved 219 ms. To put that in context Facebook gets 1.6 billion visits each week. If you do the math (219 * 1.6 billion / 1000 / 60 / 24), that’s 12.7 million days’ worth of time saved every year. Or put another way, it’s a lifetime worth of time people would have otherwise spent waiting for Facebook pages to load saved every two and a half hours!

If we consider that in the context of the Amazon figure simply changing their CA could be worth nearly one hundred million a year.

Before you start to pick apart these numbers let me say this is intended to be illustrative of how performance can effect revenue and not be a scientific exercise, so to save you the trouble some issues with these assumptions include:

  • Facebook’s business is different than Amazons and the impact on their business will be different.
  • I only did four samples of the SSL negotiation and a scientific measurement would need more.
  • The performance measurement I used for OCSP was an average and not what was actually experienced in the sessions I tested – It would be awesome if WebPageTest could include a more granular breakdown of the SSL negotiation.

With that said clearly even without switching there are a few things Facebook still can do to improve how they are deploying SSL.

Regardless I am still thrilled Facebook has decided to go down this route, the change to deploy Always-On-SSL will go a long way to help the visitors to their sites.

Ryan

A quick look at SSL performance

When people think about SSL performance they are normally concerned with the performance impact on the server, specifically they talk about the computational and memory costs of negotiating the SSL session and maintaining the encrypted link.  Today though it’s rare for a web server to be CPU or memory bound so this really shouldn’t be a concern, with that said you should still be concerned with SSL performance.

Did you know that at Google SSL accounts for less than 1% of the CPU load, less than 10KB of memory per connection and less than 2% of network overhead?

Why? Because studies have shown that the slower your site is the less people want to use it. I know it’s a little strange that they needed to do studies to figure that out but the upside is we now have some hard figures we can use to put this problem in perspective. One such study was done by Amazon in 2008, in this study they found that every 100ms of latency cost them 1% in sales.

That should be enough to get anyone to pay attention so let’s see what we can do to better understand what can slow SSL down.

Before we go much further on this topic we have to start with what happens when a user visits a page, the process looks something like this:

  1. Lookup the web servers IP address with DNS
  2. Create a TCP socket to the web server
  3. Initiate the SSL session
  4. Validate the certificates provided by the server
  5. Establish the SSL session
  6. Send the request content

What’s important to understand is that to a great extent the steps described above tasks happen serially, one right after another – so if they are not optimized they result in a delay to first render.

To make things worse this set of tasks can happen literally dozens if not a hundred times for a given web page, just imagine that processes being repeated for every resource (images, JavaScript, etc.) listed in the initial document.

Web developers have made an art out of optimizing content so that it can be served quickly but often forget about impact of the above, there are lots of things that can be done to reduce the time users wait to get to your content and I want to spend a few minutes discussing them here.

First (and often forgotten) is that you are dependent on the infrastructure of your CA partner, as such you can make your DNS as fast as possible but your still dependent on theirs, you can minify your web content but the browser still needs to validate the certificate you use with the CA you get your certificate from.

These taxes can be quite significant and add up to 1000ms or more.

Second a mis(or lazily)-configured web server is going to result in a slower user experience, there are lots of options that can be configured in TLS that will have a material impact on TLS performance. These can range from the simple certificate related to more advanced SSL options and configuration tweaks.

Finally simple networking concepts and configuration can have a big impact on your SSL performance, from the basic like using a CDN to get the SSL session to terminate as close as possible to the user of your site to the more advanced like tuning TLS record sizes to be more optimum.

Over the next week or so I will be writing posts on each of these topics but in the meantime here are some good resources available to you to learn about some of these problem areas:

Reading ocspreport and crlreport at x509labs.com

As you may know I have been hosting some performance and up-time monitors at: http://ocspreport.x509labs.com and http://crlreport.x509labs.com.

I started this project about six months ago when I walked the CAB Forum membership list, visited the sites of the larger CAs on that list, looked at their certificates and extracted both OCSP and CRL urls and added them into custom monitor running on AWS nodes.

Later I tried Pingdom and finally settled on using Monitis because Pingdom doesn’t let you control which monitoring points are used and doesn’t give you the ability to do comparison views. That said as a product I liked Pingdom much better.

As for how I configured Monitis, I did not do much — I set the Service Level Agreement (SLA) for uptime to 10 seconds which is the time required to be met by the CABFORUM for revocation responses. I also selected all of the monitoring locations (30 of them) and set it loose.

I put this up for my own purposes, so I could work on improving our own service but I have also shared it publicly and know several of the other CAs that are being monitored are also using it which I am happy to see.

OK, so today I found myself explaining a few things about these reports to someone so I thought it would be worthwhile to summarize those points for others, they are:

  1. Why is it so slow to render? – Unfortunately despite numerous requests to Monitis there is nothing I can do about this – Monitis is just slow.
  2. Why does it show downtime so often? – I do not believe the downtime figures, most of the time the failures show up on all of the urls. The times I have looked into theses it turned out the failures were at Monitis or due to regional network congestion / failures. Unfortunately this means we cannot rely on these figures for up-time assessment, at best they are indicators when looked at over long periods of time.
  3. Why do some tests show at 0-1 ms? – This is likely because the Monitis testing servers are located in the same data center as the OCSP servers in question. This skews the performance numbers a little bit but the inclusion of many perspectives should off-set this.

At this point I suspect you’re wondering, with these shortcomings what is this thing good for anyways? That’s a good question; OCSP (and CRLs) are a hidden tax that you and your users pay when they visit your site.

This is important because studies have found a direct correlation between latency and user abandonment and seriously who doesn’t just want their site to be fast as possible.

My hope is these resources help you understand what that tax is; if you’re a CA operator it can also help you tweak your performance as well as get an idea of what the global user experience is for the relying parties of your certificates.

On a related note I do think someone could make a pretty penny if they made an easy to use, yet powerful monitoring site 🙂

Serving OCSP on a CDN

So last week we moved our revocation repositories behind a CDN, this has a number of great benefits but it does have downsides though, for example.

  1. Cache misses result in a slower response – About a 110ms in my tests.
  2. OCSP clients that create POSTs get a slower response – This is because they are treated like a cache miss.

Our CDN provider mitigates much he first issue by having a pre-loader that ensures its cache is pre-populated based on request history.

Addressing the second issue requires the CDN provider to be aware of OCSP protocol semantics, specifically the fact that one can compute what a GET request would look like by simply Base64 encoding the binary body of the POST variation.

A CDN with knowledge of this can optimize out the POST derived cache miss, our CDN has done this the change has not yet propagated to all of their datacenters but where it has POST performs the same as a GET.

Hopefully this optimization will have propagated to all their datacenters by next week, when this logic is fully deployed the clients that generate POST based OCSP requests (without a nonce) will also have ~100ms response times.

I should probably ad that in our case almost all of the POST based OCSP requests we receive come from Firefox and do not contain a nonce, hopefully soon Firefox will move to using GET for requests without a nonce like other clients.

Using Monitis to monitor OCSP and CRL performance

Earlier I did a post on the performance of revocation repositories, in that I used the Monitis do some basic bench-marking for repository performance.

They have a cool feature that allows me to create a public monitoring portal on one of my own domains, I have created two:

  1. OCSP Performance
  2. CRL Performance

It also looks like CloudFlare (one of our CDN partners), the ones we are working with to get these great numbers have also done a blog post on what we are doing here – cool stuff!

Ryan


Revocation repositories, IPv6 support, message size, and performance

So the last few weeks I have spent a reasonable amount of time looking at performance and networking related problems associated with revocation repositories. I still have some additional work to do but I figured I would capture some of my findings in a quick post.

CRL repositories and IPv6
CA Host Supports V6
GlobalSign crl.globalsign.com Yes
Comodo crl.comodoca.com No/Sometimes
CyberTrust sureseries-crl.cybertrust.ne.jp No
Symantec/GeoTrust EVSSL-crl.geotrust.com No
Symantec/VeriSign EVIntl-crl.verisign.com No
DigiCert crl3.digicert.com No
StartSSL crl.startssl.com No
TrustWave crl.securetrust.com No
TrustCenter crl.ix.tcclass3.tcuniversal-i.trustcenter.de No
GoDaddy crl.godaddy.com No
Entrust crl.entrust.net No
Certum crl.certum.pl No

* IPv6 Capability was checked via http://ipv6-test.com/validate.php


OCSP repositories and IPv6
CA Host Supports V6
GlobalSign ocsp.globalsign.com Yes
COMODO ocsp.comodoca.com No
GoDaddy ocsp.godaddy.com No
DigiCert ocsp.digicert.com No
StartCom ocsp.startssl.com No
TrustCenter ocsp.tcuniversal-I.trustcenter.de No
TrustWave ocsp.trustwave.com No
Enstrust ocsp.entrust.net No
Symantec/GeoTrust ocsp.geotrust.com No
Symantec/VeriSign ocsp.verisign.com No
CyberTrust sureseries-ocsp.cybertrust.ne.jp No
Certum ocsp.certum.pl No

* IPv6 Capability was checked via http://ipv6-test.com/validate.php


CRL Size
CA CRL Size # Entries
Certum http://crl.certum.pl/evca.crl 862 7
Symantec/Geotrust http://EVSSL-crl.geotrust.com/crls/gtextvalca.crl 720 12
Cybertrust http://sureseries-crl.cybertrust.ne.jp/SureServer/2021_ev/cdp.crl 1742 17
GlobalSign http://crl.globalsign.com/gs/gsextendvalg2.crl 1114 18
TrustWave http://crl.securetrust.com/STCA.crl 2158 65
StartSSL http://crl.startssl.com/crt4-crl.crl 2339 90
DigiCert http://crl3.digicert.com/evca1-g1.crl 5393 100
GoDaddy http://crl.godaddy.com/gds3-37.crl 6848 153
Comodo http://crl.comodoca.com/COMODOExtendedValidationSecureServerCA.crl 12959 351
TrustCenter http://crl.ix.tcclass3.tcuniversal-i.trustcenter.de/crl/v2/tc_class3_L1_CA_IX.crl 16138 407
Entrust http://crl.entrust.net/level1e.crl 40995 1005
Symantec/VeriSign http://EVIntl-crl.verisign.com/EVIntl2006.crl 207922 5972
* CRL count was determined using “curl url>crl & openssl crl -in crl -inform der -text | grep -c “Serial”
* Size was determined using the Content-Length header, “curl –verbose –url *”


OCSP response Size
CA Host Size
Comodo ocsp.comodoca.com 471
Digicert ocsp.digicert.com 471
GlobalSign ocsp2.globalsign.com 1491
CyberTrust sureseries-ocsp.cybertrust.ne.jp 1588
StartSSL ocsp.startssl.com 1596
Symantec/Verisign ocsp.verisign.com 1739
GoDaddy ocsp.godaddy.com 1923
Entrust ocsp.entrust.net 1939
Certum ocsp.certum.pl 2113
Trustwave ocsp.trustwave.com 2519
TrustCenter ocsp.tcuniversal-I.trustcenter.de 3135
Symantec/Geotrust ocsp.geotrust.com 3346

* Size was determined using the Content-Length header, “curl –verbose –url *”


OCSP Response Performance
CA Host Average (ms)
GlobalSign ocsp2.globalsign.com

95

DigiCert ocsp.digicert.com

156

GoDaddy ocsp.godaddy.com

163

COMODO ocsp.comodoca.com

202

StartCom ocsp.startssl.com

280

Enstrust ocsp.entrust.net

293

Symantec/GeoTrust ocsp.geotrust.com

293

Symantec/VeriSign ocsp.verisign.com

295

TrustWave ocsp.trustwave.com

297

TrustCenter ocsp.tcuniversal-I.trustcenter.de

389

CyberTrust sureseries-ocsp.cybertrust.ne.jp

421

Certum ocsp.certum.pl

568

* Measuring with Monitis points in US-MID, US-EST-US-WST, Canada, Denmark, Netherlands, Germany, Spain, UK, Sweden, China, Austrailia, Signapore, Japan were used.


CRL Repository Performance
CA Host Average (ms)
GlobalSign crl.globalsign.com 101
DigiCert crl3.digicert.com 102
Entrust crl.entrust.net 120
Comodo crl.comodoca.com 178
GoDaddy crl.godaddy.com 186
StartCom crl.startssl.com 267
TrustWave crl.securetrust.com 272
Symantec/GeoTrust EVSSL-crl.geotrust.com 298
Symantec/Verisign EVIntl-crl.verisign.com 298
TrustCenter crl.ix.tcclass3.tcuniversal-i.trustcenter.de 371
Certum crl.certum.pl 426
CyberTrust sureseries-crl.cybertrust.ne.jp 454
* Measuring with Monitis points in US-MID, US-EST-US-WST, Canada, Denmark, Netherlands, Germany, Spain, UK, Sweden, China, Austrailia, Signapore, Japan were used.